
Decisions from data, not gut feel
Stop making calls on hunches and estimates. The statistics show you what's really happening in the business — where the money comes from, when the rush hits, and which programs and customers matter most.
- Peak hours, so you can staff to demand
- Best-performing wash programs and most-washed vehicles
- Your best customers, ranked by activity
- Revenue and outstanding washes, a click away
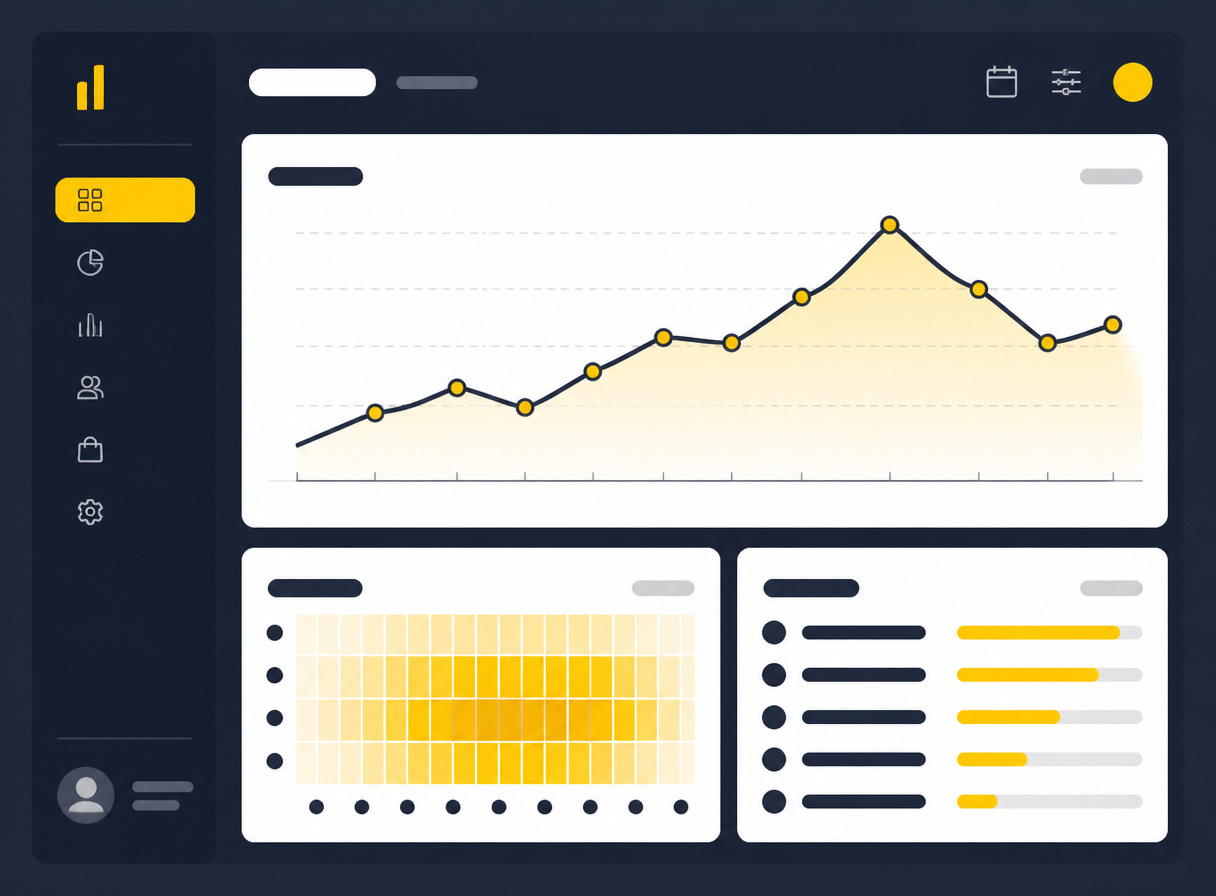
Staff to demand
When you can see your busiest hours, you put people where the work is and stop paying for quiet ones.
Price with confidence
Program and customer data show what to promote, what to reprice, and what to retire.
Protect cash flow
A clear view of paid versus outstanding washes tells you exactly who to follow up with.
Statistics & reporting FAQ
What do the statistics show?
Your peak hours, your best-performing wash programs, which vehicles are washed most often, who your best customers are, and your revenue — all available with a click.
Do I need to export to a spreadsheet first?
No. The reports are built into the system and show your key numbers with a single click, so you can check the business daily instead of assembling a report at month-end.
How does reporting help me cut costs?
By replacing guesswork. Seeing your peak hours helps you staff to demand, seeing program performance guides pricing, and seeing which washes are still outstanding protects cash flow.
Time for the future of your truck wash
Tell us about your bays, lanes, and locations, and we'll show you the system in action — then set up your free trial.
14-day free trial · No fixed costs · No hidden costs